.svg "DELMIC")
.png)


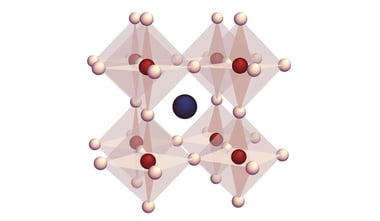
The paper entitled ‘Time-resolved cathodoluminescence investigations of AlN:Ge/GaN nanowire structures’ presents the study of different functional parts of individual AlN/GaN nanowire superlattices and their decay characteristics. With cathodoluminescence imaging, the authors are able to individually analyze the different functional parts of the nanowires.
Improving the efficiency of light-emitting diodes has a high economic and ecological potential. Particularly Blue- and white-light emitting diodes (LEDs), largely based on GaN multi-quantum-well structures, are commonly used for energy-efficient lighting. A recurring issue for the structures that are grown in the crystallographic c-direction is the quantum-confined Stark effect (QSCE) which reduces device performance.
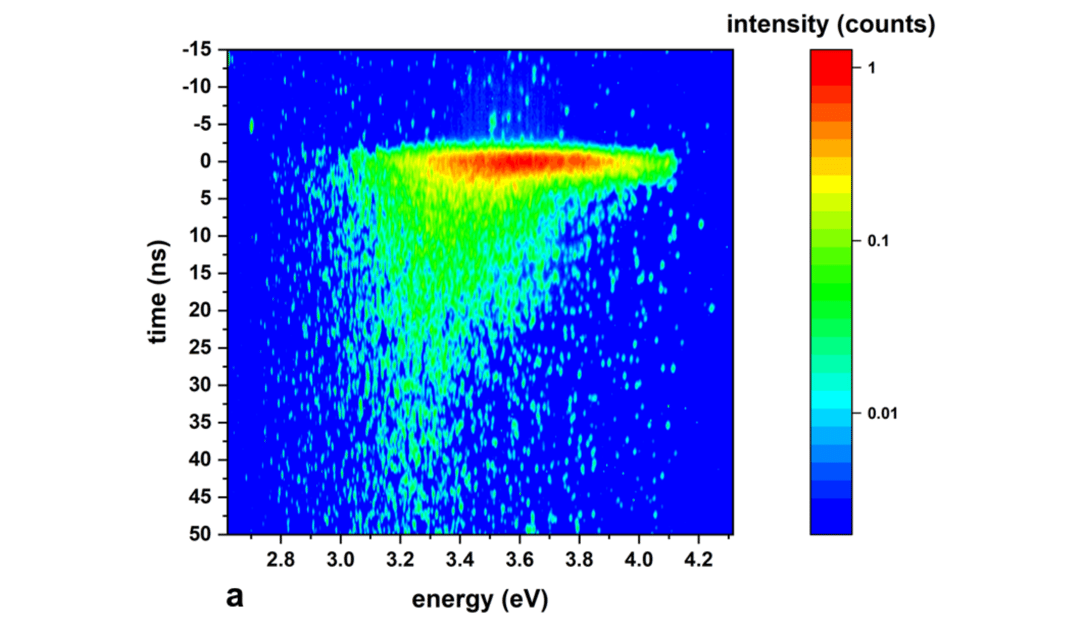
In their research, the authors use time-integrated and time-resolved cathodoluminescence to investigate the QCSE in GaN/AlN nanowire superlattice structures. A Delmic SPARC Spectral CL detector equipped with a streak camera for hyperspectral time-resolved measurements was used for CL measurements. The authors were able to observe a blue shift of the emitted light when going from the nanowire cap to the upper stem by selectively exciting different regions of the nanostructures. The time-resolved measurements demonstrated the shielding of the QCSE with Ge-doped samples which may be employed in the future to improve device performance in LEDs.
The authors conclude that time-resolved cathodoluminescence is a powerful tool for investigating carrier dynamics in different parts of individual nanowires with high temporal and spatial resolution.
To read the whole paper, please access it here.
Image: Streak camera image of S2 at a sample temperature of 10 K, representing the time-resolved CL emission. The intensity of the emitted light is plotted on a logarithmic scale as a function of energy and time after excitation of the nanowire. Source: Jörgen Jungclaus et al., Nano Ex. 2 (2021)