.svg "DELMIC")
.png)


In the realm of nanotechnology, studying thermal properties at the nanoscale is crucial for understanding and improving the efficiency and sensitivity of devices. As integrated electronic circuits continue to shrink, the on-chip power density has increased dramatically, creating a critical need for effective thermal management in nanoscale transistors.
Highly concentrated energy densities and fewer thermal conduction pathways in nanodevices can lead to elevated temperatures, which can significantly impact the performance of various nanotechnology applications, such as nanowire single-photon detectors, nanowire lasers, and thermoelectric nanostructures.
Challenges in measuring thermal conductivity
Past research has focused on engineering thermal conductivity by measuring or tailoring phonon mean free path spectra [1-9]. However, measuring both the temperature and thermal conductivity of nanostructures has been notoriously difficult using existing techniques, such as near-field scanning optical microscopy [10,11], scanning thermal microscopy [12,13], and transmission electron microscopy [14-26].
These methods offer high spatial resolution but can be slow, require cumbersome probes, or need very thin samples. Common thermal conductivity measurement methods like the 3ω method [17,18], suspended microchip method [19-21], and time-domain thermoreflectance [4,5,9,22-24] lack high spatial resolution and may require invasive fabrication or a transducer layer [23,25]. Accurate measurement of thermal conductivity in nanostructures is essential for designing devices that can maintain stable operation under varying temperature conditions.
Overcoming traditional limitations
In this blog, we explore an important study that employed cathodoluminescence (CL) spectroscopy to overcome these challenges. The CL thermometry technique offered high-resolution, noninvasive temperature measurements at low beam currents and acted as a nearly delta-function heat source at high currents.
Applying this technique to GaN nanowires, the study mapped out temperature profiles from an electron-beam-induced heat source and extracted thermal conductivity using three methods: two with a DC electron beam current and one with an ultrafast electron beam blanker for AC heating/thermometry.
This method provided higher spatial resolution than laser-based techniques [24], fast scan speeds, variable probing/heating depth, and no need for near-field probes or thin samples, enabling nanoscale phononic and thermal transport studies in semiconductors, including in situ measurements of silicon-integrated circuits.
Experimental approach
Temperature measurements
The study introduced a method for temperature measurements using cathodoluminescence (CL) in GaN nanowires. The CL setup involved a parabolic mirror inside the SEM chamber, aligned so that its focal point corresponded to the electron beam focus on the sample. The mirror collected the light emitted from the sample and directed it to a spectrometer. The nanowires, with diameters of 200−300 nm, were fabricated by a top-down approach and exhibited lasing properties [27] under optical pumping.
The CL intensity map showed emission between 360 and 420 nm, and a red shift in the peak bandgap emission indicated temperature increases as the electron beam was focused on the wire. The setup allowed for the observation of CL properties and thermal behavior of the nanowires under high current electron beam irradiation, indicating negligible degradation of the wires during CL measurements.
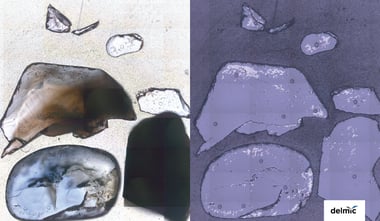
Figure 1: Nanoscale thermometry CL measurement technique and monitored signals
(a) Schematic of cathodoluminescence (CL) measurements on a semiconductor nanowire. An electron beam heats/excites the semiconductor nanowire, and incoherent CL is collected by a high-numerical-aperture parabolic mirror and directed into a spectrometer. (b) SEM image of a GaN nanowire taken simultaneously with CL data, using a 210 nA 5 keV electron beam. (Inset) Zoomed-in region of the GaN wire. (c) CL counts integrated between 360–420 nm. (d, e) Peak CL wavelength extracted by fitting spectra with a Lorentzian for experiments with electron beam currents of 210 nA (d) and 1.6 nA (e). Gray regions indicate peaks of less than 10 counts. (f) Temperature map generated by focusing the electron beam (210 nA) at each pixel. (g) CL spectra obtained at positions indicated by color dots in (b) and (c). The degree of overlap between the electron beam and the nanowire determines the energy absorbed, resulting in a maximum temperature rise and red-shift of CL emission when the beam is centered. The gray curve represents CL from a 1.6 nA electron beam at the location of the red dot (with a 50× longer exposure time), and other curves are from a 210 nA electron beam. Scale bars: 500 nm.
The study employed CASINO [28] Monte Carlo simulations to determine the energy conversion to heat in the wire and subsequent thermometry by tracking the shift in the peak bandgap emission energy as a function of temperature. Monte Carlo simulations revealed that approximately 71% of the electron energy was converted to heat in the wire. The study calibrated the wavelength shift with temperature by measuring the bandgap shift from 90 to 300 K and fitting the data to the Varshni equation [29].
Temperature maps were created by fitting the CL data with the Varshni equation, with nanowires placed on a copper TEM grid and heat sunk via electron beam-assisted Pt deposition. Maps at different electron beam currents showed the largest temperature rise at the wire’s center, as expected for a 1D system with an internal heat source.
DC thermal conductivity measurements
In the DC measurement techniques, the wire was suspended over a hole in the TEM grid and heated by a continuous electron beam. The steady-state temperature was extracted at every point along the wire.
Figure 2: Probing nanowire thermal conductivity with a DC electron beam

(a) Measured temperature along a GaN wire (inset), with an orange line showing the best fit for the DC bridge method. The thermal conductivity of the GaN nanowire is 22 ± 4.7 W/m·K, and for the Pt/GaN portion, it is 91 ± 18.9 W/m·K. Base temperature is 161 K, and wire radius is 118 nm. (b) DC slope method for determining thermal conductivity of different nanowires with one end at a fixed temperature. Data points from 100 μm and 1 mm apertured electron beams are shown, with corresponding thermal conductivities in the legends. Nanowire radii are 130 ± 11.8, 123 ± 5.8, and 142 ± 11.4 nm for wires A, B, and C, respectively. (c) Schematic of the temperature profile for the DC bridge method. (d) Thermal circuit model for the DC bridge method. (e) Schematic of the temperature profile for the DC slope method. (f) Thermal circuit model for the DC slope method. (g) SEM images and peak wavelength maps for each wire, with peak wavelength measured using an electron beam current of 1 nA to minimize heating. Doping-induced wavelength shifts were subtracted to produce the curves in (b). Scale bars: 500 nm.
The first method, the DC bridge method, involved anchoring both ends of the nanowire with SEM-deposited Pt and suspending it over a bare copper TEM grid hole. An equivalent resistance model was formed for the wire, similar to previous work [32]. The system was represented by a thermal circuit model, where the thermal resistance was given by R = lA/κ, with l being the relevant length of the particular segment and κ the thermal conductivity of that segment.
The second method, the DC slope method [31], involved anchoring only one end of the wire, allowing the other end to extend into the center of the hole. In this method [31], the temperature rise when the electron beam was at position x away from the edge of the hole was given by an equation that includes the thermal contact resistance (Rc) and the heat flux (Q̇). By finding the slope of the temperature rise and solving for κGaN, the expression κGaN = Q̇/(sA) was obtained, where A is the wire’s cross-sectional area determined from SEM images, and Q̇ is the heat flux calculated from the measured electron beam current, corrected for energy losses.
The thermal conductivities of three wires measured using the DC slope method were presented, ranging from 19 to 66 W/m·K with errors from 10% to 21%. These errors primarily stemmed from variations in wire diameter and, for certain data points, from a 10% error in Q̇.
Both DC methods were affected by localized doping variations, which could be corrected by separately determining the effects of doping and temperature on the bandgap. Uncertainties in heat flux (Q̇) could also affect measurements, particularly when using large currents and apertures.
The accuracy of the DC slope method was verified by using an aperture to ensure all electron beam current struck the wire in a nanometer-sized spot.
AC thermal conductivity measurements
The AC thermal conductivity measurement used a high-frequency electrostatic beam blanker to modulate the electron current in a square wave on/off pattern. The nanowire was configured with one end heat sunk with SEM-deposited Pt and the other end free.
Figure 3: Cathodoluminescence thermal conductivity measurements in the frequency domain

(a) Cathodoluminescence (CL) spectra for square wave electron beam excitation at 100 Hz (black), 200 kHz (pink), and 5 MHz (blue). Electron beam current: 42 nA DC (without modulation). (b) CL emission occurs only when electron current (red) is flowing, resulting in higher average temperatures (blue) at lower frequencies. (c) Temperature vs. electron beam square wave frequency for wires from Figure 2b,g with one end at a fixed temperature. Each plot shows multiple runs (different markers) for the same wire. The solid line is the best fit, and shaded regions represent 1 standard deviation of error. Thermal conductivities and errors are shown, with electron beam currents of 18, 29, and 29 nA DC for wires A, B, and C, respectively (current halves with modulation).
The method involved focusing the electron beam on the free end of the wire and varying the electron beam current frequency between 100 Hz and 5 MHz. The temperature at the free end of the nanowire was determined by solving the 1D time-dependent heat equation, which resulted in a complex expression involving thermal conductivity (κ), density (ρ) [33], heat capacity (Cp) [33], and wire length (L).
The study measured the average temperature over the half period when the electron beam was on, finding that the time-averaged temperature was higher at low modulation frequencies. Wavelength spectra for each modulation frequency were fit to extract temperature data for three different wires.
The thermal conductivity is extracted from the fits, with errors ranging from 4.1% to 14% for the different wires. The uncertainty in L, due to leakage Pt deposition, contributes significantly to the overall uncertainty in thermal conductivity.
The AC method’s main advantage is that it does not require knowledge of the electron beam heat flux (Q̇), which is a significant source of error in DC methods. By using a spectrometer to average the frequency-dependent optical response in time, the method sums shot noise over a wide electrical bandwidth.
To improve the signal-to-noise ratio, the study suggested using a bandpass filter to isolate a small wavelength range near the bandgap CL emission and monitor amplitude modulation via lock-in detection during pulsed electron beam excitation. This approach would drastically improve the signal-to-noise ratio by reducing the bandwidth over which noise was summed.
Comparative analysis of thermal conductivity measurement methods
The study compared thermal conductivity measurements of GaN nanowires using different methods. Bulk GaN has a reported thermal conductivity of 130−220 W/m·K [34,35], while previous studies on nanowires using the suspended microchip method or photoluminescence found values of 13−19 W/m·K [21] for smaller diameters and <80 W/m·K [30] for similar diameters, agreeing with the study’s results of 19−68 W/m·K.
The deviation from bulk values was attributed to decreased phonon mean free path due to Si impurities [21,36,37] and other factors like boundary scattering and phonon confinement. The study's nanowires were intentionally doped with Si during growth.
The DC slope and AC methods were compared using data from the same wires. The extracted thermal conductivities were within error for wires A and B but not for wire C, although all measurements showed lower-than-bulk thermal conductivity. The study discussed potential reasons for discrepancies, such as non-uniform wire cross-sectional area and beam drift.
Both DC and AC methods had advantages and disadvantages. DC methods offered easier examination of heat-sinking quality and higher spatial resolution but were more sensitive to doping variations. The AC method allowed for faster data collection but may have had lower spatial resolution and sensitivity to beam drift.
The study assumed constant thermal conductivity and wire cross-sectional area in the models, which may not account for variations due to doping. The AC method did not require knowledge of electron beam heat flux or wire cross-sectional area, unlike DC methods.
The major drawback of the thermometry method was the influence of localized doping heterogeneity on the bandgap energy. Doping from Si impurities created ∼1 nm variations in the peak bandgap wavelength, corresponding to a ∼50 K equivalent temperature variation.
To maximize accuracy, high-resolution low-current mapping of the bandgap shifts of the entire sample at different temperatures could separate the doping background from the temperature shift. The study assumed doping only shifted the calibration curve offset, which was previously observed to be a reasonable assumption [26].
A modification of the AC method could measure thermal conductivity without a calibration curve by assuming temperature scales linearly with bandgap shifts and fitting the peak wavelength data directly to extract thermal conductivity.
Conclusion
The study presented a cathodoluminescence (CL) nanothermometry method for semiconductors, along with three different methods for measuring the thermal conductivity of GaN (or other semiconductor) nanowires. CL thermometry could be used with shallow currents to measure temperatures without heating the sample or with high currents to act as a heat source for studying thermal transport.
The study demonstrated that GaN, Si, and GaAs exhibited shifts in CL bandgap emission with temperature, indicating that the temperature mapping and thermal transport measurements were broadly applicable to other semiconductors. This could be useful for examining integrated circuits in situ to find defects, for example.
The thermal conductivity measurement methods were rapid and had low fabrication requirements. The framework for laser-based pump−probe measurements of thermal conductivity could be translated into the SEM using CL nanothermometry, potentially offering 100x better spatial resolution than state-of-the-art methods [24].
The tunability of electron penetration depth in SEMs (from nanometers to microns, controlled by electron energy) opened up possibilities for heat transport studies in nanolayers currently inaccessible by photon-based studies.
Overall, CL nanothermometry-based methods offered a powerful framework for studying phonon dynamics, ballistic transport, and near-field heat transport phenomena with high resolution and control.
Based on the study - https://pubs.acs.org/doi/10.1021/acsnano.1c00850
References
- Yang, F., & Dames, C. (2013). Mean free path spectra as a tool to understand thermal conductivity in bulk and nanostructures. Physical Review B, 87(3). https://doi.org/10.1103/physrevb.87.035437
- Poudel, B., Hao, Q., Ma, Y., Lan, Y., Minnich, A., Yu, B., Yan, X., Wang, D., Muto, A., Vashaee, D., Chen, X., Liu, J., Dresselhaus, M. S., Chen, G., & Ren, Z. (2008). High-Thermoelectric performance of nanostructured bismuth antimony telluride bulk alloys. Science, 320(5876), 634–638. https://doi.org/10.1126/science.1156446
-
Luckyanova, M. N., Garg, J., Esfarjani, K., Jandl, A., Bulsara, M. T., Schmidt, A. J., Minnich, A. J., Chen, S., Dresselhaus, M. S., Ren, Z., Fitzgerald, E. A., & Chen, G. (2012). Coherent phonon heat conduction in superlattices. Science, 338(6109), 936–939. https://doi.org/10.1126/science.1225549
-
Yang, B., & Chen, G. (2003). Partially coherent phonon heat conduction in superlattices. Physical Review. B, Condensed Matter, 67(19). https://doi.org/10.1103/physrevb.67.195311
-
Minnich, A. J., Chen, G., Mansoor, S., & Yilbas, B. S. (2011). Quasiballistic heat transfer studied using the frequency-dependent Boltzmann transport equation. Physical Review B, 84(23). https://doi.org/10.1103/physrevb.84.235207
-
Huang, B., Hsiao, T., Lin, K., Chiou, D., & Chang, C. (2015). Length-dependent thermal transport and ballistic thermal conduction. AIP Advances, 5(5). https://doi.org/10.1063/1.4914584
-
Dresselhaus, M. S., Chen, G., Tang, M. Y., Yang, R. G., Lee, H., Wang, D. Z., Ren, Z. F., Fleurial, J., & Gogna, P. (2007). New directions for Low‐Dimensional Thermoelectric materials. Advanced Materials, 19(8), 1043–1053. https://doi.org/10.1002/adma.200600527
-
Sood, A., Xiong, F., Chen, S., Cheaito, R., Lian, F., Asheghi, M., Cui, Y., Donadio, D., Goodson, K. E., & Pop, E. (2019). Quasi-Ballistic thermal transport across MOS2 thin films. Nano Letters, 19(4), 2434–2442. https://doi.org/10.1021/acs.nanolett.8b05174
-
Hu, Y., Zeng, L., Minnich, A. J., Dresselhaus, M. S., & Chen, G. (2015). Spectral mapping of thermal conductivity through nanoscale ballistic transport. Nature Nanotechnology, 10(8), 701–706. https://doi.org/10.1038/nnano.2015.109
-
Yue, Y., Chen, X., & Wang, X. (2011). Noncontact Sub-10 nm Temperature Measurement in Near-Field Laser Heating. ACS Nano, 5(6), 4466–4475. https://doi.org/10.1021/nn2011442
- Vertikov, A., Kuball, M., Nurmikko, A. V., & Maris, H. J. (1996). Time-resolved pump-probe experiments with subwavelength lateral resolution. Applied Physics Letters, 69(17), 2465–2467. https://doi.org/10.1063/1.117499
-
Varesi, J., & Majumdar, A. (1998). Scanning Joule expansion microscopy at nanometer scales. Applied Physics Letters, 72(1), 37–39. https://doi.org/10.1063/1.120638
-
Shi, L., Plyasunov, S., Bachtold, A., McEuen, P. L., & Majumdar, A. (2000). Scanning thermal microscopy of carbon nanotubes using batch-fabricated probes. Applied Physics Letters, 77(26), 4295–4297. https://doi.org/10.1063/1.1334658
-
Idrobo, J. C., Lupini, A. R., Feng, T., Unocic, R. R., Walden, F. S., Gardiner, D. S., Lovejoy, T. C., Dellby, N., Pantelides, S. T., & Krivanek, O. L. (2018). Temperature measurement by a nanoscale electron probe using energy gain and loss spectroscopy. Physical Review Letters, 120(9). https://doi.org/10.1103/physrevlett.120.095901
-
Yan, X., Liu, C., Gadre, C. A., Dai, S., Gu, L., Yu, K., Aoki, T., Wu, R., & Pan, X. (2019). Unexpected strong thermally induced phonon energy shift for mapping local temperature. Nano Letters, 19(10), 7494–7502. https://doi.org/10.1021/acs.nanolett.9b03307
-
Mecklenburg, M., Hubbard, W. A., White, E. R., Dhall, R., Cronin, S. B., Aloni, S., & Regan, B. C. (2015). Nanoscale temperature mapping in operating microelectronic devices. Science, 347(6222), 629–632. https://doi.org/10.1126/science.aaa2433
-
Cahill, D. G. (1990). Thermal conductivity measurement from 30 to 750 K: the 3ω method. Review of Scientific Instruments, 61(2), 802–808. https://doi.org/10.1063/1.1141498
-
Birge, N. O. (1986). Specific-heat spectroscopy of glycerol and propylene glycol near the glass transition. Physical Review. B, Condensed Matter, 34(3), 1631–1642. https://doi.org/10.1103/physrevb.34.1631
-
Kim, P., Shi, L., Majumdar, A., & McEuen, P. L. (2001). Thermal transport measurements of individual multiwalled nanotubes. Physical Review Letters, 87(21). https://doi.org/10.1103/physrevlett.87.215502
-
Shi, L., Li, D., Yu, C., Jang, W., Kim, D., Yao, Z., Kim, P., & Majumdar, A. (2003). Measuring thermal and thermoelectric properties of One-Dimensional nanostructures using a microfabricated device. Journal of Heat Transfer, 125(5), 881–888. https://doi.org/10.1115/1.1597619
-
Guthy, C., Nam, C., & Fischer, J. E. (2008). Unusually low thermal conductivity of gallium nitride nanowires. Journal of Applied Physics, 103(6). https://doi.org/10.1063/1.2894907
-
Cahill, D. G. (2004). Analysis of heat flow in layered structures for time-domain thermoreflectance. Review of Scientific Instruments, 75(12), 5119–5122. https://doi.org/10.1063/1.1819431
-
Wilson, R. B., & Cahill, D. G. (2014). Anisotropic failure of Fourier theory in time-domain thermoreflectance experiments. Nature Communications, 5(1). https://doi.org/10.1038/ncomms6075
-
Ultra-fast thermoreflectance imaging for electronic, optoelectronic, and thermal devices. (n.d.). IEEE Conference Publication | IEEE Xplore. https://ieeexplore.ieee.org/document/8972732
-
Jiang, P., Qian, X., & Yang, R. (2018). Tutorial: Time-domain thermoreflectance (TDTR) for thermal property characterization of bulk and thin film materials. Journal of Applied Physics, 124(16). https://doi.org/10.1063/1.5046944
- Davidson, S. M., and A. W. Vaidya. "High-Resolution Temperature Measurements in Microwave Devices." Gallium Arsenide and Related Compounds(Edinburgh), 1976. Institute of Physics, London. 1977, 287-295 (1976).
- Damilano, B., Coulon, P., Vézian, S., Brandli, V., Duboz, J., Massies, J., & Shields, P. (2019). Top-down fabrication of GaN nano-laser arrays by displacement Talbot lithography and selective area sublimation. Applied Physics Express, 12(4), 045007. https://doi.org/10.7567/1882-0786/ab0d32
-
Demers, H., Poirier-Demers, N., Couture, A. R., Joly, D., Guilmain, M., De Jonge, N., & Drouin, D. (2011). Three‐dimensional electron microscopy simulation with the CASINO Monte Carlo software. Scanning, 33(3), 135–146. https://doi.org/10.1002/sca.20262
-
Varshni, Y. (1967). Temperature dependence of the energy gap in semiconductors. Physica, 34(1), 149–154. https://doi.org/10.1016/0031-8914(67)90062-6
-
Westover, T., Jones, R., Huang, J. Y., Wang, G., Lai, E., & Talin, A. A. (2009). Photoluminescence, thermal transport, and breakdown in Joule-Heated GAN nanowires. Nano Letters, 9(1), 257–263. https://doi.org/10.1021/nl802840w
-
Doerk, G. S., Carraro, C., & Maboudian, R. (2010). Single Nanowire Thermal conductivity measurements by Raman Thermography. ACS Nano, 4(8), 4908–4914. https://doi.org/10.1021/nn1012429
-
Hsu, I., Kumar, R., Bushmaker, A., Cronin, S. B., Pettes, M. T., Shi, L., Brintlinger, T., Fuhrer, M. S., & Cumings, J. (2008). Optical measurement of thermal transport in suspended carbon nanotubes. Applied Physics Letters, 92(6). https://doi.org/10.1063/1.2829864
-
Levinshtein, Michael E., Sergey L. Rumyantsev, and Michael S. Shur, eds. Properties of Advanced Semiconductor Materials: GaN, AIN, InN, BN, SiC, SiGe. John Wiley & Sons, 2001.
-
Sichel, E., & Pankove, J. (1977). Thermal conductivity of GaN, 25–360 K. Journal of Physics and Chemistry of Solids, 38(3), 330. https://doi.org/10.1016/0022-3697(77)90112-3
-
Jeżowski, A., Danilchenko, B., Boćkowski, M., Grzegory, I., Krukowski, S., Suski, T., & Paszkiewicz, T. (2003). Thermal conductivity of GaN crystals in 4.2–300 K range. Solid State Communications, 128(2–3), 69–73. https://doi.org/10.1016/s0038-1098(03)00629-x
-
Florescu, D. I., Asnin, V. M., Pollak, F. H., Molnar, R. J., & Wood, C. E. C. (2000). High spatial resolution thermal conductivity and Raman spectroscopy investigation of hydride vapor phase epitaxy grown n-GaN/sapphire (0001): Doping dependence. Journal of Applied Physics, 88(6), 3295–3300. https://doi.org/10.1063/1.1289072
-
Zou, J. (2010). Lattice thermal conductivity of freestanding gallium nitride nanowires. Journal of Applied Physics, 108(3). https://doi.org/10.1063/1.3463358