.svg "DELMIC")
.png)


Microplastic pollution has emerged as a significant environmental concern in recent years. These tiny plastic particles, often smaller than 5mm, can be found in various ecosystems. Not only do they pose a threat to marine life, but they can also find their way into our food chain, potentially impacting human health [8,9].
Detecting micro- and nanoplastics (MNPs) in the environment is no small feat [1]. These particles come in various sizes, shapes, and colors, making them difficult to identify using traditional methods such as FTIR and Raman [2,3,7].
Limitations of using FITR for microplastic detection
- Sample preparation: FTIR requires the sample to be dry to avoid interference from moisture. This can be challenging when dealing with wet environmental samples, and additional steps for drying may be necessary.
- Irregular shapes: FTIR can struggle with the analysis of irregularly shaped microplastics. Reflectance measurements from such samples can lead to refractive errors, affecting the accuracy of the analysis.
- Size limitations: While FTIR can be used for the analysis of plastic particles larger than 500 μm, it may not be as effective for smaller particles.
- Time-consuming: Analyzing large sample areas with high spatial resolution can be time-consuming, which can be a limitation when dealing with extensive environmental samples.
- Destructive analysis: Some FTIR methods, such as attenuated total reflection (ATR), can be destructive to the sample, which may not be desirable for certain types of analyses.
Limitations of Raman spectroscopy for microplastic detection
- Fluorescence interference: Raman spectroscopy can be affected by the presence of fluorescent substances in the sample. This interference can obscure the Raman signal, making it difficult to identify microplastics accurately.
- Sample purity: The technique requires the sample to be relatively pure, as the presence of other organic matter can complicate the analysis and lead to false identifications.
- Size limitations: While Raman spectroscopy can detect plastic particles down to 1 µm, it may not be as effective for particles smaller than this size.
- Non-polar plastics: Raman spectroscopy responds better to non-polar plastics like polypropylene (PP) and polyethylene (PE), but may not be as effective for polar plastics.
- Complex environmental samples: The technique may struggle with complex environmental samples that contain a mixture of different types of microplastics and other materials.
A new approach to microplastics detection
To combat the growing microplastics problem, researchers at the Netherlands Organization for Applied Scientific Research (TNO) conducted a study. Published in 2022, the proof of concept study aims to address the issue by utilizing a combination of scanning electron microscopy (SEM) with cathodoluminescence (CL) for efficient detection and identification of MNPs.
In their analysis, the researchers focused on six of the most common plastic types found in the environment: high-density polyethylene (HDPE), low-density polyethylene (LDPE), polystyrene (PS), polypropylene (PP), polyamide (PA), and polyethylene terephthalate (PET).
It included approximately 20 different samples for each plastic type, totaling 111 samples. To ensure the model's robustness, a combination of reference and consumer plastics, including the influence of additives and colors were collected.
Combining SEM and CL for microplastic identification
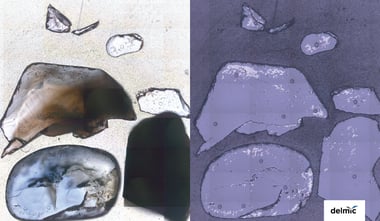
The researchers combined two sophisticated techniques, scanning electron microscopy (SEM) and cathodoluminescence (CL), to characterize and identify microplastics. For SEM analysis, samples were prepared either by cutting cross-sections or filtering suspensions, followed by applying a thin conductive carbon film.
CL experiments were conducted using a field emission scanning electron microscope and a Delmic SPARC Spectral system. The CL spectra were collected using a VIS-NIR optical module. To identify the different plastics, raw CL spectra were aggregated, and spectral features were identified using three methods: peak finding on aggregated spectra, peak finding on derivative plots, and finding anomalies using the ‘Local Outlier Factor Score’ method [4]. A total of 212 features were identified for all plastic types to be used as potential input for the classification model. As an example, the selected features for polystyrene (PS) are shown below in Fig. 1
Fig. 1. Features selected for polystyrene (PS) using the three methods
Developing effective microplastic classification models
The research utilized principle component analysis (PCA) to reduce data dimensionality before employing Artificial Neural Networks (ANN) for the classification of plastics based on their chemical composition. Three models were developed, with the dataset split into training and test sets:. General Model for all plastics, a Combined Model for grouping LDPE and HDPE with other plastics, and a PE model specifically for LDPE and HDPE. A 5-fold cross-validation process was used for hyperparameter tuning. The H2O package in R was employed to create multi-layer feedforward artificial neural networks for the models [5,6]. The classification performance was evaluated using the test set.
Significant findings on microplastics classification
The researchers collected cathodoluminescence (CL) spectra from 111 samples of six common plastic types, demonstrating visible differences in spectral shape, intensities, and peak values. Variance in composition was observed among samples of the same plastic type. Interestingly, no spectral differences were found between black and white/transparent samples of the same type. The technique was shown to be suitable for detecting a wide range of plastics, including difficult samples such as black plastics or those with different additives.
Fig. 2. CL spectra of the six plastic types used in the classification mode (aggregated using median values for each plastic type)
The study took a feature selection approach on the CL spectra of six plastic types, resulting in a set of 212 highly correlated spectral features. Principal component analysis (PCA) was then used to decrease the dataset's dimensionality, with varying numbers of principal components tested for accuracy on the training set. The first 2 PCs explained over 94% of the variance, and 7 PCs described almost 100%. The models demonstrated high average accuracy in cross-validation, supported by low standard deviations.

Fig. 3. Score plot of PC1 and PC2 in the General Model (left) and cumulative variance per principal component (PC) (right)
Confusion matrices in the test sets revealed similar or better results compared to cross-validation. For instance, the PE model predicted both classes correctly, attaining a perfect result on the test set. The study highlighted the potential of the AI-supported SEM-CL technique for accurately classifying plastics, especially on the submicron scale.

Fig. 4. Confusion matrices on the test sets for General Model (A), Combined Model (B), and PE Model (C)
Conclusion and the future of microplastics detection
The study confirms that machine learning classification models can accurately classify plastics based on their SEM-CL spectra with over 97% accuracy in the submicron size range. This approach shows promise for identifying plastics too small for conventional techniques like μ-FTIR and μ-Raman. Future research will involve expanding the CL database and testing the model on micro- and nanoplastics, perhaps accompanied by further model optimization.
The article is based on the study here - Classification of (micro)plastics using cathodoluminescence and machine learning
References
1. Lv, L., Yan, X., Feng, L., Jiang, S., Lu, Z., Xie, H., Sun, S., Chen, J., & Li, C. (2019). Challenge for the detection of microplastics in the environment. Water Environment Research, 93(1), 5–15. https://doi.org/10.1002/wer.1281
2. Van Cauwenberghe, L., Vanreusel, A., Mees, J., & Janssen, C. R. (2013). Microplastic pollution in deep-sea sediments. Environmental Pollution, 182, 495–499. https://doi.org/10.1016/j.envpol.2013.08.013
3. Michel, A. P. M., Morrison, A. E., Preston, V. L., Marx, C. T., Colson, B. C., & White, H. K. (2020). Rapid identification of marine plastic debris via spectroscopic techniques and machine learning classifiers. Environmental Science & Technology, 54(17), 10630–10637. https://doi.org/10.1021/acs.est.0c02099
4. Breunig, M. M., Kriegel, H., Ng, R. T., & Sander, J. (2000). LOF. SIGMOD Record, 29(2), 93–104. https://doi.org/10.1145/335191.335388
5. LeDell, E., & Poirier, S. (2020). H2O AutoML: Scalable Automatic Machine Learning. In 7th ICML Workshop on Automated Machine Learning. https://www.automl.org/wp-content/uploads/2020/07/AutoML_2020_paper_61.pdf
6. Allaire, J. J. & RStudio. (n.d.). RStudio: Integrated Development Environment for R. https://www.r-project.org/conferences/useR-2011/abstracts/180111-allairejj.pdf
7. Jin, M., Liu, J., Yu, J., Zhou, Q., Wu, W., Fu, L., Yin, C., Fernandez, C., & Karimi-Maleh, H. (2022). Current development and future challenges in microplastic detection techniques: A bibliometrics-based analysis and review. Science Progress, 105(4), 003685042211321. https://doi.org/10.1177/00368504221132151
8. Yuan, Z., Nag, R., & Cummins, E. (2022). Human health concerns regarding microplastics in the aquatic environment - From marine to food systems. Science of the Total Environment, 823, 153730. https://doi.org/10.1016/j.scitotenv.2022.153730
9. Zolotova, N., Kosyreva, A., Dzhalilova, D., Fokichev, N., & Makarova, O. (2022). Harmful effects of the microplastic pollution on animal health: a literature review. PeerJ, 10, e13503. https://doi.org/10.7717/peerj.13503