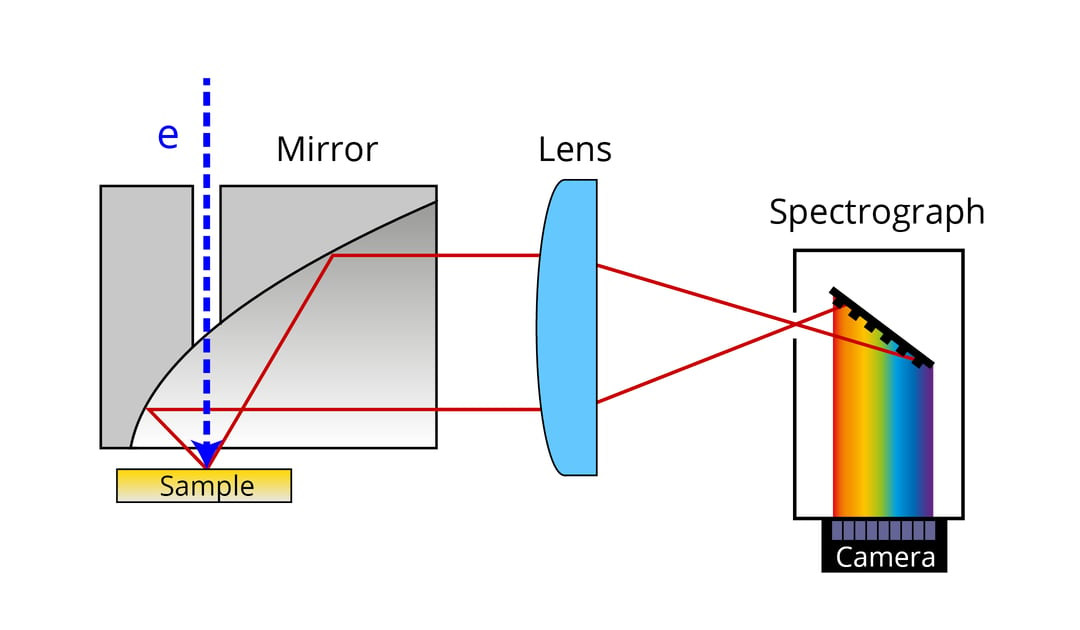
When the sample is excited with an electron beam, it produces cathodoluminescence emission. This emission is composed of light with many different wavelengths (colours). Unlike in panchromatic imaging, where the total intensity of all the wavelengths combined is measured, hyperspectral cathodoluminescence gives information on the local optical and structural properties of the material.
This wavelength information is obtained by simultaneous and parallel collection of complete spectrum, providing a high-resolution spectrum for every electron beam position. In the SPARC cathodoluminescence detector, this is done through a Czerny-Turner spectrograph containing a diffraction grating and a pixelated CCD, CMOS, or photodiode array.
The main parameters for hyperspectral imaging are the wavelength range and resolution. It is possible to show the spectrum for a specific point, but it is also possible to visualize spatial differences in the emission for every excitation position. Hyperspectral CL can be visualized with a 3D datacube, schematically with a spectra, or by extracting a (false) RGB image. A variety of imaging detectors, covering a spectral range of 200-1700 nm, can collect a complete high-resolution spectrum for every electron beam position.
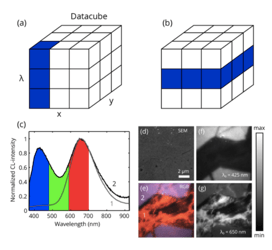
The figure shows hyperspectral CL datacube, CL spectra measured on quartz sandstone and an SEM image of a region on a quartz sandstone together with a false colour RGB image taken from λ = 380-700 nm.
If you are interested in reading more about hyperspectral cathodoluminescence imaging, make sure to download the technical note.
.svg "DELMIC")
.png)