The imaging technique that we are focusing on this week combines information acquired with angle-resolved imaging and high-resolution spectroscopy. This technique is called Lens-scanning energy-momentum (LSEK) Imaging, or full Angle-Resolved Spectroscopy, and it allows collecting a full emission spectrum for each emission angle. This new imaging technique is now available with the SPARC system. Keep reading if you would like to understand how it works and what results can be achieved.
How does it work?
This imaging technique uses the principle of angle-resolved imaging but allows users to acquire high resolution datasets both in angle and wavelength, for any given location on the sample. While angle-resolved cathodoluminescence enables momentum imaging, the lack of high spectral resolution is a drawback in some cases. Energy-momentum CL, on the other hand, can be used to accurately measure angular profiles with high energy resolution.
The dataset can be imaged by using a combination of imaging the mirror (Fourier imaging) through a motorized entrance slit and using high-resolution spectral diffraction by a grating. These hybrid datasets are acquired using a 2D CCD or CMOS array.
How can it be applied?
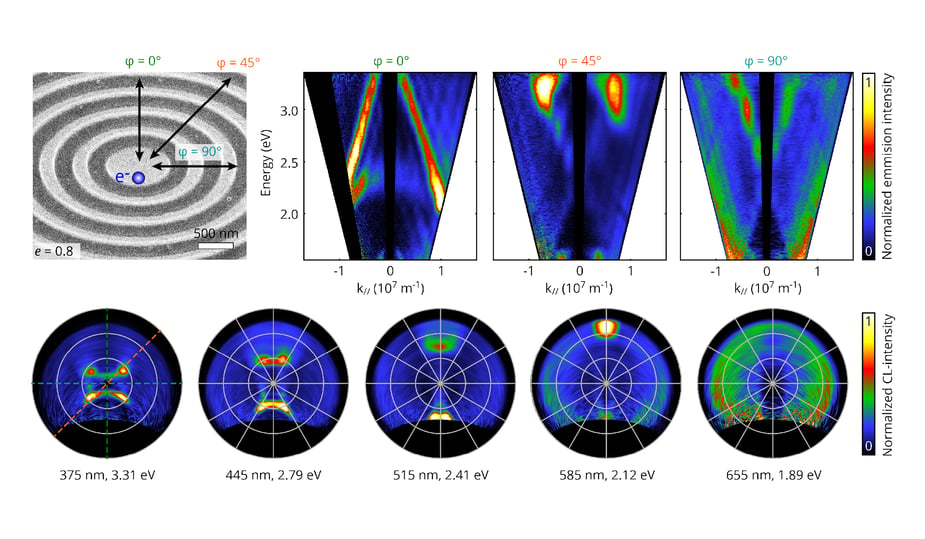
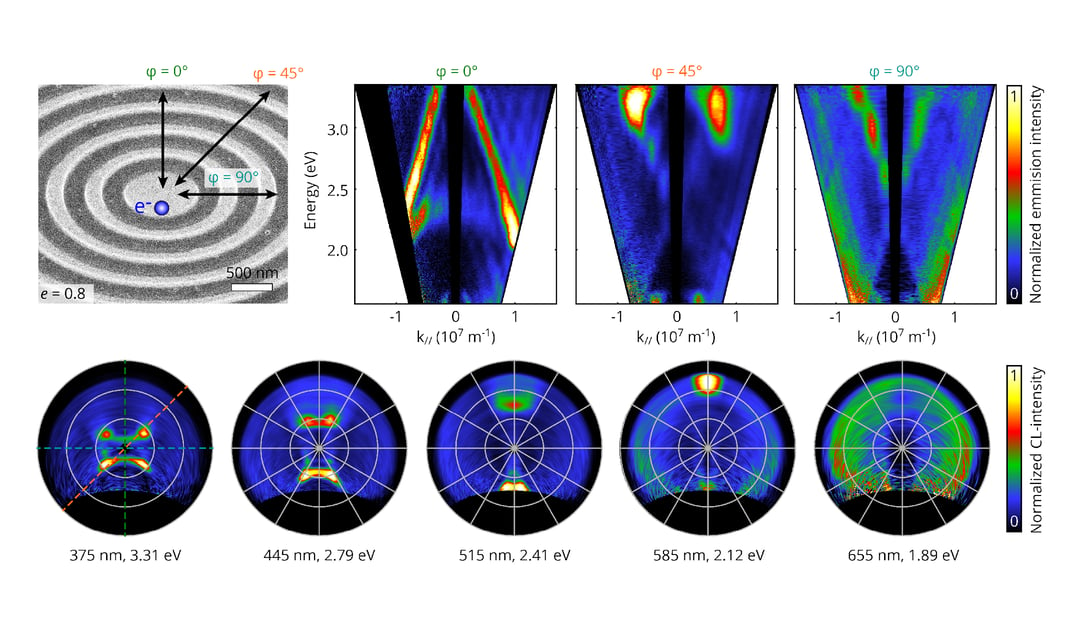
Adding a lens-scanning procedure can provide a full 3D overview of all spectral data , over the full angular range, with high angular and spectral resolution. This can be particularly interesting for the fields of nanophotonics and materials science. One of the recent studies demonstrates how LSEK imaging can be used to study the bullseye antennas and understand their radiation profile. The plasmonic bullseye antennas are versatile antennas which are used for strongly beaming light, altering polarization and generation of beams with orbital angular momentum. In the experiment LSEK CL technique was applied to track the directionality through energy and momentum space with very high precision. The study proves that energy-momentum imaging is a very powerful tool for probing the optical properties of such systems and understanding parameters for directionality control. It can be applied to a wide range of dispersive and anisotropic systems, paving the way for a broad range of studies in such applications as solid-state lighting, photovoltaics, optical computing, and sensing.

The Figure above shows a SEM micrograph of the bullseye antenna (a). The blue dot indicates the electron beam impact position. Energy-momentum (E-k) maps were acquired for (b) β = 0°, (c) β = 45°, (d) β = 90°. β represents the azimuthal angle along which the E-k map was acquired (e) shows five angular patterns for five different energies, extracted from the data set. Figure taken from Ref. [1]
To explain this technique in more detail, we are organizing a webinar on the 24th of April. Make sure to register below.
References
[1] T. Coenen and A. Polman, ACS Photonics 6, 573-580 (2019)
.png)


