Ultraviolet (UV) emitting LEDs hold promise for various applications including sterilization of water. Currently, bulk UV LED systems suffer from relatively low efficiencies but nanoscale growth/structuring provides a route towards more efficient devices. Such a decrease in the dimensions of these objects requires a high-resolution analysis method to optimize their performance.
Cathodoluminescence (CL), is the photon emission produced by excitation with an electron beam. CL spectroscopy is a powerful tool that enables the collection of the light emitted from a nanometer-sized excitation spot, and the study of the energy (color) of this light.
Time-resolved cathodoluminescence (TRCL) gives access to the time dynamics of photon emission, which can be altered in the presence of defects in the light-emitting device. TRCL requires synchronized excitation and detection of the CL emission. From the measured time delay between the excitation and the detection, a histogram can be constructed, which gives access to dynamics, such as the lifetime of an emitter.
Spende and collaborators from the Technische Universität Braunschweig studied the performance of a new type of structure for UV LEDs [1].
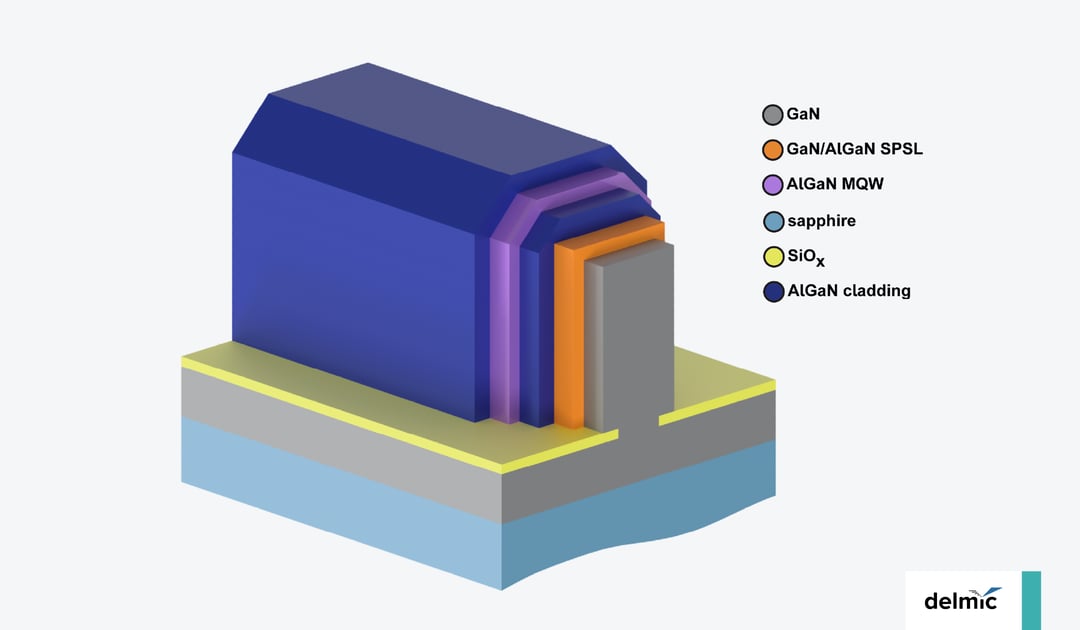
They grew complex structures with alternate layers of GaN and AlGaN in various concentrations to improve the crystal quality of such devices. They produced structures with low dislocation densities of the order of 107 cm-2, which they quantified with CL intensity mapping (Figure 1).
Figure 1: CL emission of a microfin structure. (A) View of the AlGaN microfins under 30° angle measured with 5 keV electron energy with the SE signal (left), and CL panchromatic intensity map (right), (B) CL spectrum as a function of the position along the microfin structure, in the rectangular area highlighted in (A).
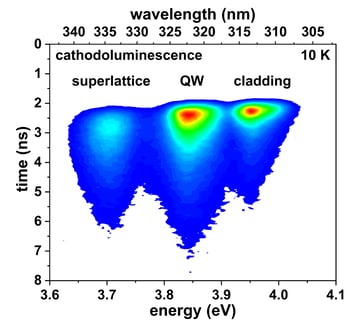
To have more information on how the decrease of dislocation and structural defects influences the light emission of their device, they measured the time dynamics of CL emission with Delmic’s SPARC Spectral system optimized for the UV range (Figure 2). This specific CL system is composed of an SEM with a fast electrostatic blanker, to produce pulsed electron beam excitation, and the SPARC system is equipped with a streak camera that enables the synchronized detection of CL.
Moreover, the temperature was controlled between 10 and 300 K with a Helium cryo sample stage. Typically, the temperature plays an important role in light emission: depending on the temperature, various interactions come into play to influence the photon emission, such as phonon (crystal lattice vibrations) scattering or defect trapping of charge carriers.
With these measurements, the authors discovered an unexpected dynamics regime at low temperatures (10-40 K).
This regime corresponds to an emission lifetime increase with decreasing temperature. The usual behavior for semiconducting light emitting devices at these temperatures is the opposite, i.e., a decrease of lifetime with decreasing temperature, due to the lowering of interactions between photons and phonons. They attributed this effect to charge carrier localization phenomena.

Figure 2: Time-resolved CL streak map, which corresponds to the decay trace within the spectral range, measured on the sidewall of a microfin at 10kV. The decay trace extension depends on the spectral feature probed.
With a dedicated model, adapted from Corfir and collaborators [2], they accessed the internal quantum efficiency, which is a characteristic parameter quantifying the efficiency of light emission of a system. They estimated it to be about 40% at room temperature, which is promising for the future production of such devices.
In conclusion, the CL intensity measurement has enabled Spende and collaborators to quantify defect density, and time-resolved CL measurements have enabled them to access the lifetime of the solid-state UV emitters. TRCL makes it easy to systematically study the efficiency of the UV emitter at the nanometer scale. This paper shows that TRCL using the SPARC system could optimize the UV LED growth workflow.
References
[1] H. Spende et al. ACS Photonics, 2021
[2] Corfdir et al. Phys. Rev. B: Condens. Matter Mater. Phys. 2011, 83, 245326
.png)


